Mining Social Media Data
Contents
8.3. Mining Social Media Data#
Data mining is the process of taking a set of data and trying to learn new things from it.
Fig. 8.1 Clip from movie Everything Everywhere All at Once where the IRS agent talks about what information (“story”) she can mine from tax data.#
For example, social media data about who you are friends with might be used to infer your sexual orientation. Social media data might also be used to infer people’s:
Race
Political leanings
Interests
Susceptibility to financial scams
Being prone to addiction (e.g., gambling)
Additionally, groups keep trying to re-invent old debunked pseudo-scientific (and racist) methods of judging people based on facial features (size of nose, chin, forehead, etc.), but now using artificial intelligence.
Social media data can also be used to infer information about larger social trends like the spread of misinformation.
One particularly striking example of an attempt to infer information from seemingly unconnected data was someone noticing that the number of people sick with COVID-19 correlated with how many people were leaving bad reviews of Yankee Candles saying “they don’t have any scent” (note: COVID-19 can cause a loss of the ability to smell):
![Tweet by eleanor (@zomsllama). Tweet says, "blue line: daily COVID cases in the USA. red line: bad reviews of Yankee Candles on Amazon saying 'they don't have any scent'. sources: google and [sic]." The tweet has a graph from 8 Apr to 13 Nov, showing a blue line that goes up and down noisily but with two big peaks. A much smoother red line has two big peaks lining up the blue big peaks.](../_images/covid_candles.png)
Fig. 8.2 Twitter user @zomsllama pointing out the correlation of COVID cases and candle reviews complaining of no scent.#
8.3.1. Spurious Correlations#
One thing to note in the above case of candle reviews and COVID is that just because something appears to be correlated, doesn’t mean that it is connected in the way it looks like. In the above, the correlation might be due mostly to people buying and reviewing candles in the fall, and diseases, like COVID, spreading most during the fall.
It turns out that if you look at a lot of data, it is easy to discover spurious correlations where two things look like they are related, but actually aren’t. Instead, the appearance of being related may be due to chance or some other cause. For example:
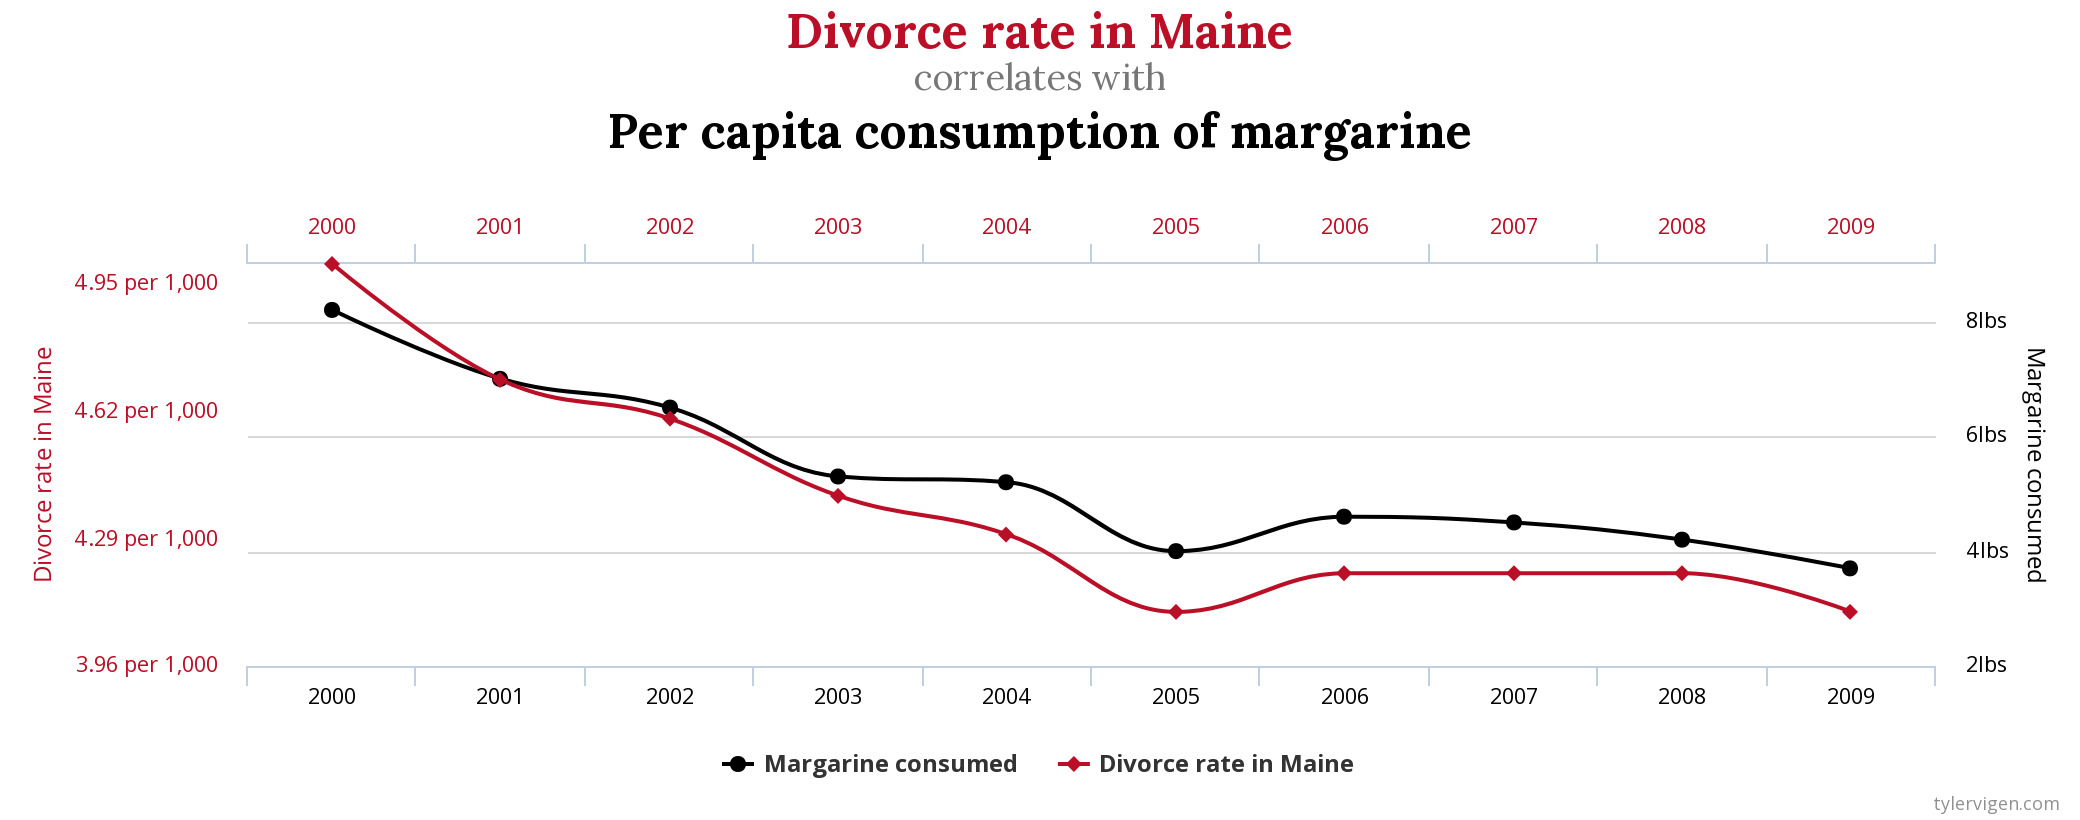
Fig. 8.3 An example spurious correlation from Tyler Vigen’s collection of Spurious Correlations#
By looking at enough data in enough different ways, you can find evidence for pretty much any conclusion you want. This is because sometimes different pieces of data line up coincidentally (coincidences happen), and if you try enough combinations, you can find the coincidence that lines up with your conclusion.
If you want to explore the difficulty of inferring trends from data, the website fivethirtyeight.com has an interactive feature called “Hack Your Way To Scientific Glory” where, by changing how you measure the US economy and how you measure what political party is in power in the US, you can “prove” that either Democrats or Republicans are better for the economy. Fivethirtyeight has a longer article on this called “Science Isn’t Broken: It’s just a hell of a lot harder than we give it credit for.”